
0 引 言
行星探测雷达是进行行星内部探测的最佳地球物理手段之一,该技术在月球和火星探测中已得到了广泛且成功的应用[7-9]。对于绝大多数尺度小于数十千米的小行星,轨道探测雷达相较于车载雷达更具适用性和优势。根据系统配置不同,小行星轨道探测雷达主要分为双站雷达和单站雷达。双站雷达通常由两台雷达组成,分别位于小行星轨道器和着陆器(或轨道器);而单站雷达则由一台位于轨道器的雷达组成[10-11]。迄今为止,仅有欧空局的“罗塞塔”(Rosetta)彗星探测任务利用双站雷达对彗星67P实现了科学探测[12]。2024年10月7日,欧空局的“赫拉”(Hera)小行星探测器成功发射升空,计划于2026年底利用单站雷达对双星小行星系统“迪迪莫斯”(Didymos)进行科学探测[13]。2025年5月29日,“天问”二号探测器成功发射升空,标志着我国首次小天体探测任务正式开启。“天问”二号探测器携带单站雷达,其科学任务是获取小天体表层及次表层雷达回波,进而研究这两个小天体的内部结构和物质成分[14-15]。因此,为确保“天问”二号单站雷达科学数据的有效处理与解释,亟需系统开展基于单站雷达的小行星内部结构成像方法研究。
得益于Rosetta任务的成功实施,研究人员提出了许多基于双站雷达的小行星内部结构成像方法[11,16-22]。相比之下,基于单站雷达的相关研究则相对较少。Sava等[18-19]提出了适用于单站雷达的螺旋观测模式的三维小行星内部结构逆时偏移成像方法和层析成像方法。王玉军等[23]提出一种次表层雷达二维环绕扫描层析成像方法,实现了简单二维洋葱状小天体内部结构成像。Dufaure等[24]提出了基于感应电流重建理论的小行星内部结构时域和频域成像方法[25],并利用单站雷达测量数据实现了小行星模型的内部结构重建。为了快速得到较准确的内部结构成像结果,胡超然等[26]提出了基于快速分解后向投影算法的小天体快速三维成像方法。然而,上述方法仍存在以下两方面的局限:一是多数方法只能获得小行星内部结构成像结果,而难以进一步解析其物质成分信息;二是少数能够获得物性分布的成像方法主要依赖反射波振幅信息,导致成像分辨率仍有待提高。
电磁波全波形反演(Full-Waveform Inversion,FWI)是一种利用观测雷达数据的振幅、相位和到时等信息来反演介质的电性参数分布的高分辨率成像技术。目前,FWI在探地雷达和双站雷达数据反演中均取得成功应用[10,27-28]。为了从单站雷达数据中重建小行星的内部结构和介电常数分布,本文提出一种基于单站雷达的小行星内部结构三维FWI方法。首先,通过三维双层洋葱型小行星模型的反演实验,验证了反演算法的可行性和有效性。然后,根据“天问”二号单站探测雷达观测系统的初步设计方案,系统分析了轨道数量、雷达观测点数量和相邻轨道间距对反演结果的影响,从而为“天问”二号任务的实际雷达观测系统设计提供科学依据。
1 单站雷达简介
“天问”二号单站雷达的功能包括获取小行星2016 HO3与主带彗星311P的表层及次表层的雷达回波数据,其主要技术指标见表1 [14]。为了同时满足深穿透和高分辨率的性能要求,“天问”二号单站雷达在设计上分为低频通道和高频通道。低频通道主要用于探测整体内部结构,高频通道则是用于探测浅表层。此外,该雷达在发射功率、接收灵敏度等方面均进行了优化,以有效获取小天体的弱回波信号并抑制复杂散射效应,为反演内部结构提供可靠的数据支撑。
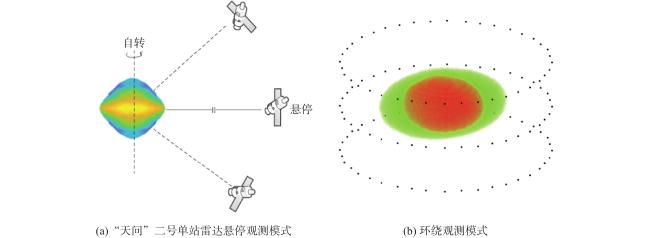
在“天问”二号进行雷达探测过程中,探测器相对于2016 HO3的自然轨道周期较长,搭载雷达的探测器与2016 HO3的相对运动主要由后者的自旋所主导[26]。如图1 (a)所示,根据“天问”二号探测雷达的设计要求[14],探测器到达指定轨道高度测站后,将与2016 HO3保持相对悬停,同时保持雷达天线对2016 HO3中心的凝视。在此过程中,利用2016 HO3的快速自旋特性,探测器能够获得观测面上不同角度的雷达回波。然后,探测器再次启动并飞行往另一个测站进行观测,直至完成三个测站的雷达观测。以小行星本体坐标系为参考系时,悬停观测模式可以等效为图1 (b)所示的环绕探测模式,即雷达先后在三个圆形轨道上环绕观测小行星。在不考虑天线形状的情况下,单站雷达可以被简化为一个点(图1 (b)中圆点)。雷达在观测轨道的不同位置向小行星发射电磁波信号,这些信号在小行星表面和内部的介电特性分界面发生反射、散射或透射,最终被雷达接收,形成单站雷达数据。
2 电磁波全波形反演基本原理
2.1 电磁波正演
电磁波在空间中的传播满足麦克斯韦方程组的两个旋度方程:
式中,${\boldsymbol{E}}$ 和${\boldsymbol{H}}$ 分别表示电场强度和磁场强度,${{\varepsilon }}$ 、$\mu$ 和$\sigma$ 分别表示介质的介电常数、磁导系数和电导率。在电磁波正反演计算时,通常采用相对介电常数${{{\varepsilon }}_{\text{r}}}$ ,定义为${{\varepsilon }}$ 和真空的相对介电常数${{{\varepsilon }}_0}$ 的比值。为求解三维电磁波的空间传播场,本文采用交错网格时域有限差分法,通过对麦克斯韦方程组进行时间和空间离散并迭代求解,从而模拟电磁波的传播过程。同时,采用坐标卷积完全匹配层作为吸收边界条件,以有效消除外向传播波的反射。
2.2 电磁波全波形反演
电磁波FWI的基本思想是通过观测数据和模拟数据的差异,来重建介质模型的介电参数(${{\varepsilon }}$ 和${\sigma}$ )空间分布[27]。为了表征模拟与实测的单站雷达数据之间的差异,构建了一个仅包含数据项的目标函数:
式中,$ {\boldsymbol{m}} $ 为模型参数向量,一般写作$ {\boldsymbol{m}} = {[{{\varepsilon }},{{ \sigma }}]^{\text{T}}} $ ,$ T $ 为雷达观测时间,$ N $ 为雷达观测点数,$ {E^{{\text{syn}}}} $ 和$ {E^{{\text{obs}}}} $ 分别为模拟和观测的单站雷达数据。
然而,式(2)的优化问题通常高度非线性且不适定,主要表现为多解性。为此,在数据项目标函数中引入全变差正则化项[29],得到如下目标函数:
式中,全变差正则化项$ ||\nabla {\boldsymbol{m}}|{|_1} $ 为电参数空间梯度的L1范数,$ \beta $ 是一个正数,用于控制目标函数中全变差正则化项的权重。由于$ ||\nabla {\boldsymbol{m}}|{|_1} $ 对$ {\boldsymbol{m}} $ 的导数在零点处有一个奇点,因此需要增加一个小的常数$ \gamma $ 来稳定算法:
式中,$ {\nabla _x} $ 、$ {\nabla _y} $ 和$ {\nabla _z} $ 分别为X、Y和Z方向上的一阶有限差分算子。参数$ \beta $ 和$ \gamma $ 对反演结果影响较为显著,因此,需要进行多次试验来确定它们的合理取值。
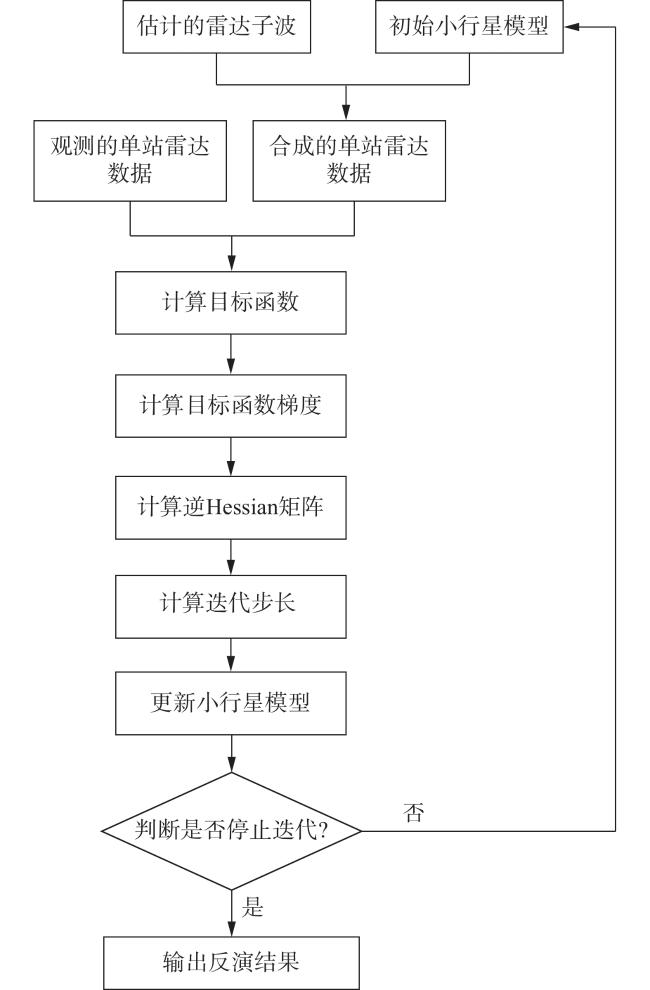
式中,$ {{\boldsymbol{m}}_k} $ 和$ {{\boldsymbol{m}}_{k + 1}} $ 分别表示第$k$ 次和$k + 1$ 次的迭代模型,$ {\alpha _k} $ 表示第$k$ 次的迭代步长,$ {{\boldsymbol{H}}_k}^{ - 1} $ 表示逆黑塞(Hessian)矩阵, $ {{\boldsymbol{g}}_k} $ 表示目标函数的梯度。从式(5)可以看出,FWI的核心任务是计算目标函数的梯度、逆Hessian矩阵和迭代步长。
式中,第一项和第二项分别为数据目标函数和正则化项关于介电常数的梯度。其中,$ {E_x} $ 、$ {E_y} $ 和$ {E_z} $ 分别表示正传波场在X、Y和Z方向的电场分量,对应于从发射天线传播到接收天线的正演波场的三个电场分量;$ E_x^{^*} $ 、$ E_y^{^*} $ 和$ E_z^{^*} $ 分别表示反传波场在X、Y和Z方向的电场分量,对应于将观测数据与正演模拟数据的差值在时间逆转后从接收天线传播到发射天线所得波场的三个电场分量。在获得目标函数的梯度后,采用有限内存Broyden–Fletcher–Goldfarb–Shanno(BFGS)算法计算Hessian矩阵的逆[11],然后采用三点抛物线拟合法计算迭代步长[11]。一般情况下,当相邻两次迭代的目标函数值之差的绝对值小于预设阈值时,即认为反演已收敛,此时终止迭代并输出反演结果。为了控制计算量并保证算法稳定性,本文将最大迭代次数设置为150,即,当迭代次数达到该上限时,反演自动终止。
3 算法验证与观测系统优化分析
3.1 算法验证
2016 HO3的尺寸约40~100 m,光谱上属于S型岩石质小行星。最新研究表明,它很可能是一颗表面存在一定厚度的风化层的独石型小行星[30]。基于此,本文构建了图3 (a1)所示的三维双层洋葱型小行星模型(下文简称“洋葱型模型”)。该模型内外球体半径分别为10 m和20 m,外层为高孔隙度岩石,内层为低孔隙度岩石,其相对介电常数分别为3和4,电导率均设为0 S/m。
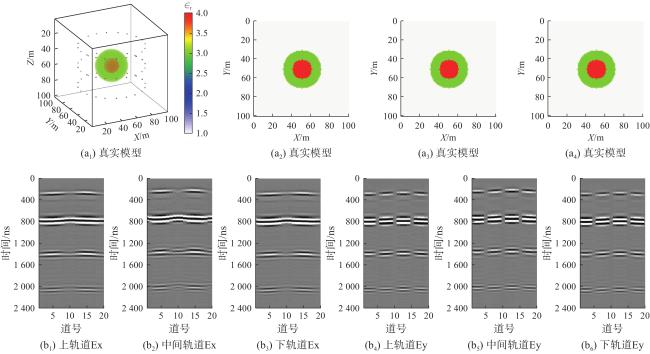
如图3 (a1)所示,三维正反演计算区域设置为101 m × 101 m × 101 m,空间步长均为1 m。洋葱型模型放置在计算区域中心,模型外部的计算区域设置为真空(相对介电常数为1,电导率为0 S/m)。雷达观测系统设置如下:三条距模型中心40 m的观测轨道,其中,中间轨道与洋葱型模型赤道面共面,上、下轨道分别位于其上、下方,间距均为25 m;每条轨道均布设20 个等间距观测点(图3 (a1)中黑色圆点)。受计算资源限制,激励源采用中心频率为10 MHz的雷克子波,时间步长为1.2 ns,时窗长度为2400 ns。激励源加载于观测点处的电场X分量并同时接收电场分量。正演模拟采用基于交错网格的三维时域有限差分法,时间与空间离散精度分别为二阶和八阶,完美匹配层吸收边界厚度为10个网格。图3 (b1)~图3 (b6)展示了三条轨道的x方向电场分量(Ex)和y方向电场分量(Ey),可以识别出四条同相轴,分别对应于由近及远的洋葱型模型内、外界面处产生的反射事件。
在雷达探测前,“天问”二号探测器将依托中视场彩色相机等载荷对2016 HO3进行全球成像,以获取其高精度三维外形数据。基于这一前提,在反演过程中可合理地假设小行星外形已知,即初始模型的外形与真实外形保持一致。相比之下,小行星的内部结构及电性参数在实际观测中往往难以直接约束,但可以通过分析雷达数据特征对其内部类型及介电常数范围进行初步推断。为便于方法验证,本文在构建小行星初始模型时,假设内部为单一均匀介质(图4 (a1)),相对介电常数为3、电导率为0 S/m。同时,为避免子波不确定性带来的额外影响,反演子波设定为与真实子波一致。在实际探测中,该子波可通过对实测雷达数据进行子波估计来获得。
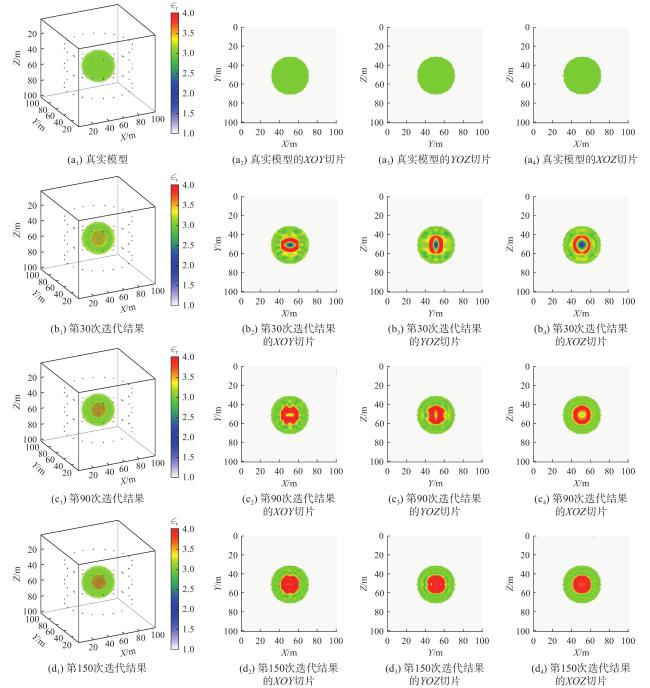
本文使用的计算资源为:1个Intel Xeon Silver 4110 CPU(128 GB内存)和1个NVIDIA Tesla V100 GPU(5 120个计算统一设备体系结构(Compute Unified Device Architecture,CUDA)核,32 GB显存,单精度峰值性能15.7 TFLOPS,双精度峰值性能7.8 TFLOPS)。为提升计算效率,正、反演过程采用了MPI(Message Passing Interface)与CUDA的混合并行加速策略。在该配置下,完成150次FWI迭代耗时40 h。图4 (b1)~图4 (d4)展示了不同迭代次数下的反演结果,可见随着迭代次数增加,反演结果逐渐逼近真实模型。对比真实模型(图3 (a1)~图3 (a4))与最终反演结果(图4 (d1)~图4 (d4))可知,FWI算法能够较好地重建洋葱型模型的双层内部结构,内外层的边界与真实边界高度吻合,介电常数分布与真实分布也十分接近。
为了定量分析反演结果的优劣,使用相对误差(Relative Error,RE)[11]定义如下:
式中,$ {\Omega _a} $ 表示反演结果的待评价区域,$ M $ 表示该区域包含的离散网格总数,$ \varepsilon $ 和$ \varepsilon ' $ 分别为该区域的真实和反演的介电常数,$ {\boldsymbol{x}} $ 为位置矢量,$ i $ 为离散网格编号。相对误差越小,说明反演结果精度越高。在三维反演实验中,当相对误差低于5.00%时,可认为反演结果具有较高精度,满足成像要求。经过计算,上述反演结果的内层和外层相对误差分别为3.39%和1.54%,表明本文提出的FWI算法可以获得较准确的内部结构和介电常数分布。
需要说明的是,虽然在仿真中采用了雷克子波作为激励源,这与“天问”二号实际的发射信号存在差异,但反演算法本身并不依赖于具体的子波形式。经脉冲压缩后的有效子波,同样表现为有限带宽的紧支撑波形,与雷克子波在频带覆盖上具有较好的可比性。此外,在方法验证阶段,本文选择了较低频率,以确保在有限的计算资源下,完成三维FWI算法的可行性测试与效果评估。FWI的核心思想并不依赖于绝对频率值,而是依赖于相对的波场传播与散射特性。因此,低频模拟结果对于评估方法的有效性仍然具有参考价值。
3.2 观测系统优化分析
3.2.1 轨道数量
理论上,观测轨道数量越多,成像精度越高,但同时会增加工程难度,如数据传输量和控制系统复杂性。因此,分析轨道数量对反演结果的具体影响显得尤为重要。在本文反演实验中,雷达观测系统分别由1条、2条和4条轨道组成,每条轨道观测点数分别为60、30和15,雷达观测点总数均为60。对应的观测系统分别如图5 (a1)、图5 (b1)和图5 (c1)所示。需要强调的是,在本文反演实验中,初始模型、反演子波和停止条件等均与第3.1节保持一致。图5 展示了不同轨道数量下的反演结果以及各方向二维切片,其中,图5 (a1)~图5 (a4)、图5 (b1)~图5 (b4)和图5 (c1)~图5 (c4)分别为1条、2条和4条轨道观测的反演结果以及对应的XOY、YOZ和XOZ切片。表2 列出了内层和外层的相对误差。
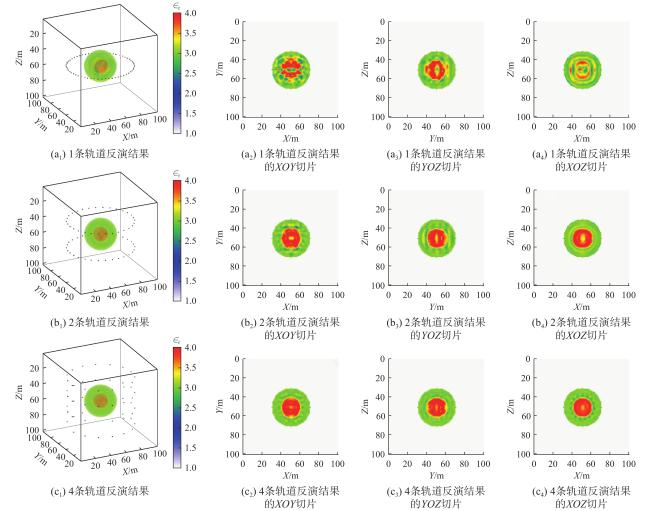
图 5 不同轨道数量的反演结果及其对应的二维切片Fig.5 The inverted results and corresponding slices based on different numbers of orbits |
表 2 不同轨道数量的反演结果的相对误差值Table 2 Relative errors of inverted results based on different numbers of orbits |
| 观测系统设置 | 反演结果 | 相对误差 | |
| 外层 | 内层 | ||
| 60点/轨道×1轨道 | 4.54% | 10.49% | |
| 30点/轨道×2轨道 | 2.61% | 5.35% | |
| 20点/轨道×3轨道 | 1.50% | 3.39% | |
| 15点/轨道×4轨道 | 1.94% | 4.49% | |
由图3 、图5 和表2 可以看出,单条轨道观测的反演结果失败,2条轨道观测的反演结果不够理想,而3条和4条轨道观测均取得较好的反演效果。但值得注意的是,4条轨道的相对误差反而略高于3条轨道的。综合反演效果与工程可行性,3条轨道被认定为较为合理的轨道数量设置。基于本次实验结果,在相邻轨道间距和观测点数理想的前提下,“天问”二号任务若采用三个悬停点进行雷达观测,可有效实现对2016 HO3内部结构的探测目标。
3.2.2 相邻轨道间距
前文已论证,通过三条轨道观测能够获得较好的反演结果,但并未对上、下轨道的位置作特殊要求。尽管“天问”二号轨道器的三个悬停位置已初步确定,在实际探测中,仍可依据小行星形状和即时观测结果灵活调整上、下悬停位置(等效于上、下轨道位置),以基于单站雷达的最佳成像效果。为简化分析,本文假设三条轨道的相邻轨道间距一致,并探讨相邻轨道间距对成像结果的影响。因此,反演实验的观测系统由3条轨道组成,每条轨道20个观测点,且相邻轨道间距分别为5 m、15 m和35 m,对应观测系统如图6 (a1)、图6 (b1)和图6 (c1)所示。图6 展示了三种间距下的反演结果及二维切片,其中,图6 (a1)~图6 (a4)、图6 (b1)~图6 (b4)和图6 (c1)~图6 (c4)分别为相邻轨道间距为5m、15m和35m时的反演结果及对应的XOY、YOZ和XOZ切片。表3 列出了内层和外层相对误差。
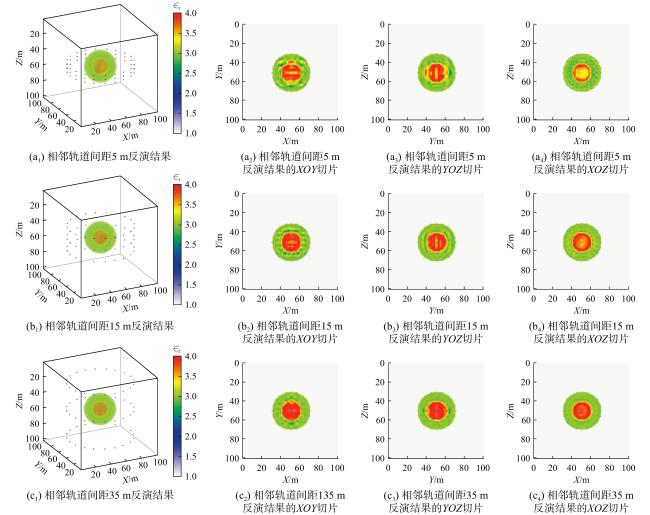
图 6 不同相邻轨道间距的反演结果及其对应的二维切片Fig.6 The inverted results and corresponding slices based on different spacings of adjacent orbits |
表 3 不同相邻轨道间距的反演结果的相对误差值Table 3 Relative errors of inverted results based on different spacings of adjacent orbits |
| 观测系统设置 | 反演结果 | 相对误差 | |
| 外层 | 内层 | ||
| 5 m相邻轨道间距 | 2.81% | 7.84% | |
| 15 m相邻轨道间距 | 2.47% | 5.05% | |
| 25 m相邻轨道间距 | 1.50% | 3.39% | |
| 35 m相邻轨道间距 | 1.50% | 4.14% | |
从图3 、图6 和表3 可以看出,当相邻轨道间距小于或等于15 m时,反演结果的内层介电常数分布误差较大,相对误差超过5%,反演结果失败;当相邻轨道间距为25~35 m时,反演结果的相对误差均在5%以内,且内外层的相对介电常数分布与真实情况也较为接近。因此,本节实验较优的相邻轨道间距应为25~35 m。基于此,在确保相邻轨道间距和观测点数理想的情况下,若“天问”二号任务采用分布于2016 HO3南北纬45°及赤道上方的三个悬停点进行雷达观测,可有效实现对2016 HO3内部结构的探测目标。
3.2.3 观测点数量
增加雷达观测点数有助于提高成像精度,但同时会增加一定的工程复杂性,更重要的是会在雷达数据成像时消耗更多计算资源。基于前文分析,当观测系统由三条轨道组成、每条轨道20个观测点且相邻轨道间距为25~35 m时,可获得较理想的反演结果。为进一步探讨观测点数量对反演结果的影响,本节反演实验的雷达观测系统为三条观测轨道,相邻轨道间距25 m,但是每条轨道上雷达观测点数分别设置为10、30和40个,即雷达观测点总数分别为30、90和120个,对应观测系统如图7 (a1)、图7 (b1)和图7 (c1)。图7 展示了反演结果及二维切片,其中,图7 (a1)~图7 (a4)、图7 (b1)~图7 (b4)和图7 (c1)~图7 (c4)分别为30、90和120个观测点的反演结果以及对应的XOY、YOZ和XOZ切片。表4 给出了四组不同雷达观测点数的反演结果内外层的相对误差。实验结果表明,在四组不同观测点数条件下,反演结果的内外层相对误差均低于5%(见表4 ),总体精度较高。但当每条轨道的观测点数为10时(见图7 (a1)~图7 (a4)),尽管反演结果内外层误差均低于5%,但内层介电常数分布存在较为明显的误差;随着观测点数增加到20,这一误差得到明显改善。综合分析可知,当每条轨道上的雷达观测点数大于20时,可获得理想的反演结果。需要说明的是,为了减少计算量,本文中轨道高度均设置为40 m,远低于“天问”二号实际探测轨道高度。由于雷达观测点数可转化为与轨道高度无关的波数空间的测量密度,因此,本文的观测系统优化分析结果对实际的高轨道观测系统设计仍具有参考价值。
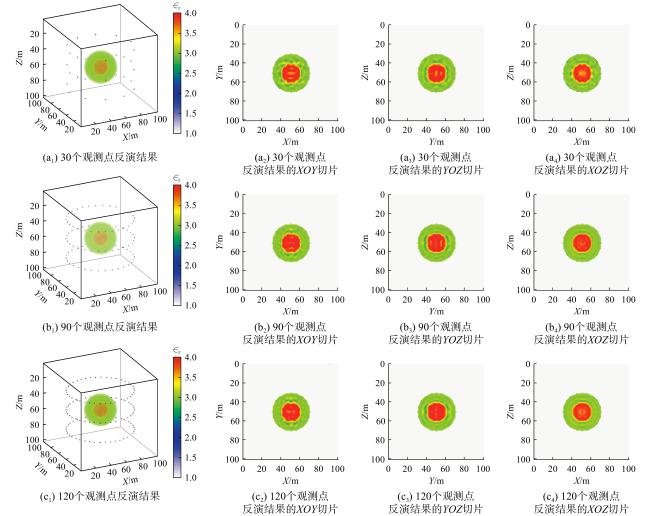


图 7 不同观测点数的反演结果及其对应的二维切片Fig.7 The inverted results and corresponding slices based on different numbers of measurement points |
表 4 不同雷达观测点数反演结果的相对误差值Table 4 Relative errors of inverted results based on different numbers of measurement points |
| 观测系统设置 | 反演结果 | 相对误差 | |
| 外层 | 内层 | ||
| 10点/轨道×3轨道 | 1.89% | 4.17% | |
| 20点/轨道×3轨道 | 1.50% | 3.39% | |
| 30点/轨道×3轨道 | 1.50% | 3.74% | |
| 40点/轨道×3轨道 | 1.56% | 3.46% | |
4 结 语
针对“天问”二号任务的小行星单站雷达数据处理需求,本文提出了一种基于单站雷达数据的小行星内部结构三维FWI算法。基于三维洋葱型模型的反演实验表明,该算法能够成功重建其内部结构及介电常数空间分布,有望为“天问”二号单站雷达数据处理与解释提供技术支撑,并有助于实现“天问”二号任务相关科学目标。
本文基于洋葱型模型开展了观测系统参数分析实验,重点考察了观测轨道数量、雷达观测点数量及相邻轨道间距对反演结果的影响。实验结果显示,当观测系统由三条轨道组成、每条轨道观测点数超过20且相邻轨道间距在25~35 m时,FWI算法可获得良好的反演效果。尽管实际探测中小行星的外形、内部结构和物质成分可能与洋葱型模型存在差异,该分析方法仍可为实际观测系统的优化提供参考。
本文的反演实验均基于低介电常数的球形洋葱型模型,后续将进一步考虑不同形状、复杂内部结构以及高介电常数差异的小行星模型,以开展FWI算法的深入研究和分析。此外,目前的FWI算法尚不支持电导率反演,也未考虑雷达天线与激励信号特性,因此,设计能够同时反演介电常数与电导率、并更贴近实际观测条件的FWI算法,将是未来的重要研究方向。在完成上述算法测试和研究的基础上,将依托高性能计算平台,开展基于“天问”二号单站雷达实际工作频段的高分辨率数值模拟与反演实验,以进一步提升研究成果与“天问”二号任务的工程适配性。